Service 03
Business Intelligence & Dashboards
Putting the right number in front of the right person at the right time.
Business Intelligence & Dashboards is the discipline of presenting information in a way that drives decisions. Where reporting tells you what happened, BI shows you why, what's changing, and where to look next. We design interactive dashboards — executive cockpits, operational consoles, and 360-degree views — that turn a clean data foundation into a tool people actually use.
A dashboard is not just a chart on a screen. A good dashboard is a designed product: it knows who its user is, what decisions that user makes, and what information helps them make those decisions faster and more accurately. Our work starts with the user, not the data. We interview the people who will use the dashboard, understand what they need to decide, and design backwards from there.
Also within this practice: bespoke web application development, and user training & dashboard governance.
- Designed for decisions, not for display — every tile maps to a choice someone has to make.
- Starts with the user, not the data — we interview before we build.
- The morning email compilation disappears — what took six emails now takes two minutes.
Scenario
The situation. A CEO wants a single screen, opened first thing every morning, that tells her how the business performed yesterday across the seven metrics that matter most. Today she relies on her assistant compiling figures by email from six department heads.
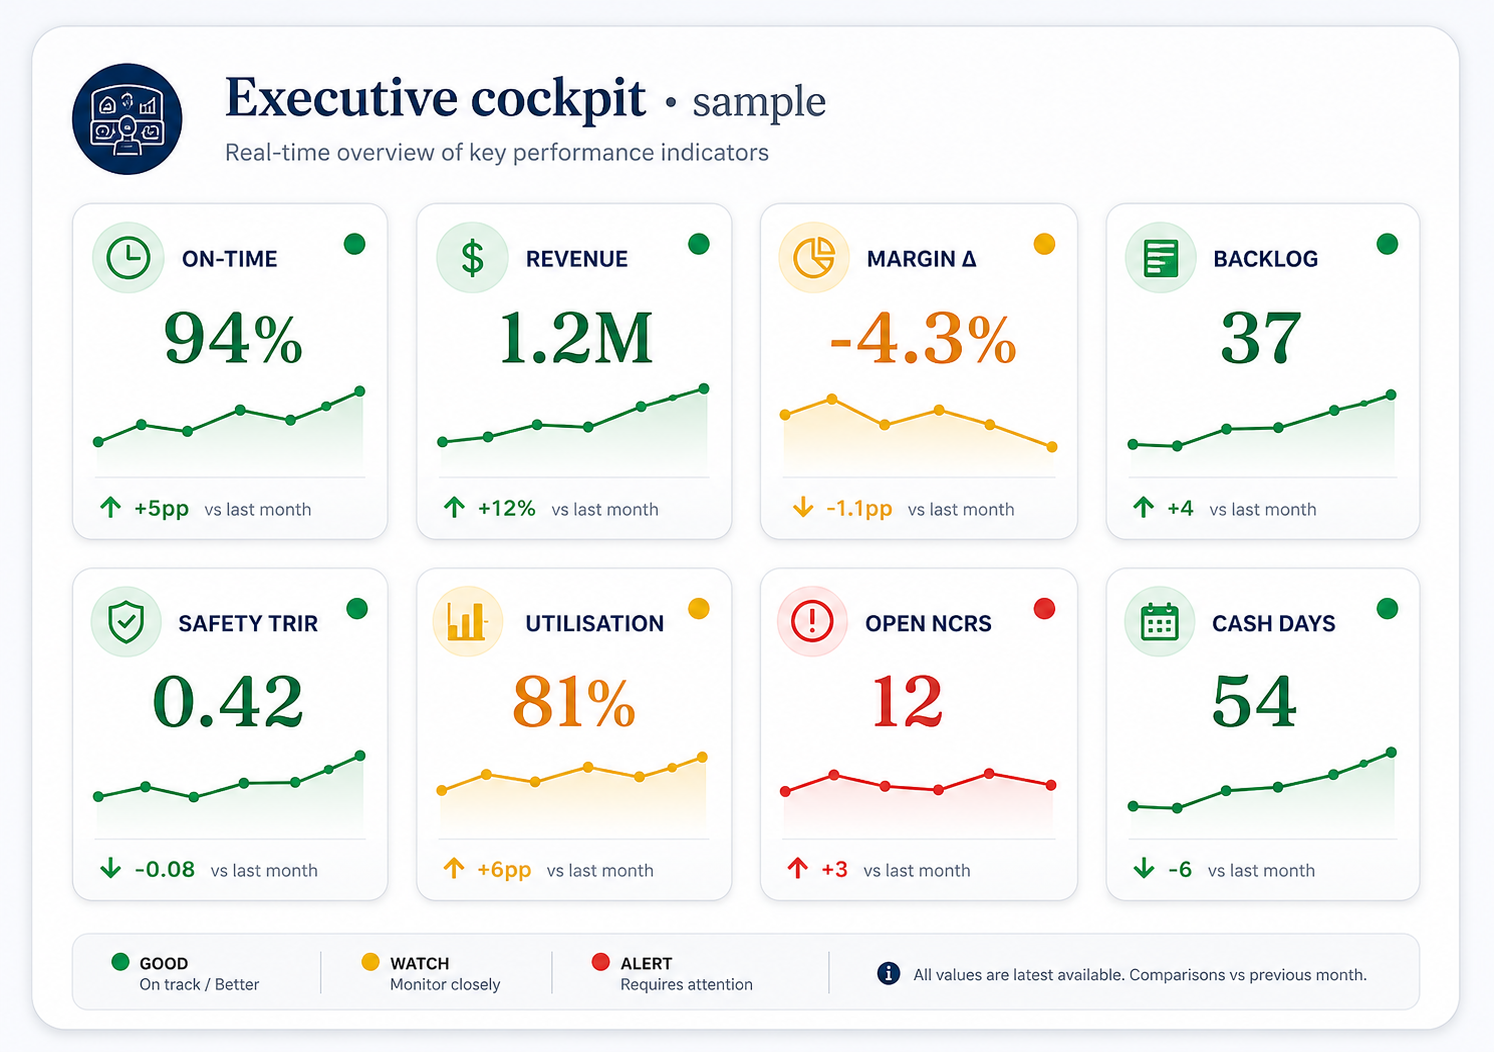
What we do. We design an executive cockpit refreshed overnight. Seven tiles, each with the metric, target, status indicator, and 30-day trend line. One click drills into detail. The compilation work disappears; the morning routine takes two minutes.